A) Greater at point K than point L.
B) Equal to zero at all points.
C) The same at points J and K.
D) Greater at point M than point L.
F) B) and C)
Correct Answer

verified
Correct Answer
verified
Multiple Choice
The study of microeconomic theory focuses on the
A) Structure and performance of individual markets and the operation of the price system.
B) Operation of the entire economy.
C) Role of the banking system in the economy.
D) Interaction of international trade and domestic production of goods and services.
F) A) and C)
Correct Answer

verified
Correct Answer
verified
Multiple Choice
Table 1.3 shows the hypothetical trade-off between different combinations of brushes and combs that might be produced in a year with the limited capacity for Country X,ceteris paribus.Complete the table by calculating the required opportunity costs for brushes and combs. Table 1.3 Production Possibilities for Brushes and Combs On the basis of your calculations in Table 1.3,the lowest opportunity cost for combs in terms of brushes is
A) 10 brushes per comb.
B) 2 brushes per comb.
C) 0.33 brush per comb.
D) 8.5 brushes per comb.
F) A) and C)
Correct Answer

verified
Correct Answer
verified
Multiple Choice
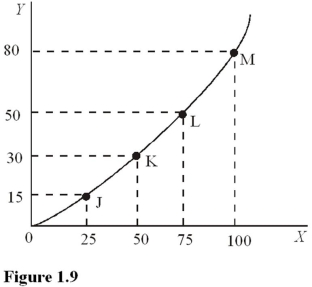
 In Figure 1.9,the slope of the line between points L and M is
A) 1.20.
B) 0.80.
C) 0.75.
D) 0.67.
F) A) and D)
Correct Answer

verified
Correct Answer
verified
Multiple Choice
The opportunity cost of studying for an economics test is
A) Negative because it may improve your grade.
B) Zero because you knew when you registered for the class that studying would be required.
C) The money you spent on tuition for the class.
D) The best alternative use of your time.
F) A) and C)
Correct Answer

verified
Correct Answer
verified
Multiple Choice
Economic growth would best be represented by a
A) Shift outward of the production possibilities curve.
B) Shift inward of the production possibilities curve.
C) Movement from inside the production possibilities curve to a point on the production possibilities curve.
D) Movement from the production possibilities curve to a point inside the production possibilities curve.
F) B) and C)
Correct Answer

verified
Correct Answer
verified
Multiple Choice
Table 1.3 shows the hypothetical trade-off between different combinations of brushes and combs that might be produced in a year with the limited capacity for Country X,ceteris paribus.Complete the table by calculating the required opportunity costs for brushes and combs. Table 1.3 Production Possibilities for Brushes and Combs On the basis of your calculations in Table 1.3,what is gained by producing at point M rather than point N?
A) 23 combs.
B) 21 combs.
C) 1 comb.
D) 2 combs.
F) B) and D)
Correct Answer

verified
Correct Answer
verified
Multiple Choice
Microeconomics is concerned with issues such as
A) The demand for bottled water by individuals.
B) The level of inflation in the economy.
C) Maintaining a strong level of economic growth.
D) All of the choices are correct.
F) A) and C)
Correct Answer

verified
Correct Answer
verified
Multiple Choice
Macroeconomics focuses on the performance of
A) Individual consumers.
B) Government agencies.
C) The overall economy.
D) All of the choices are correct.
F) A) and B)
Correct Answer

verified
Correct Answer
verified
Multiple Choice
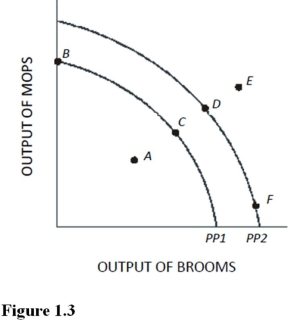
 Using Figure 1.3 and PP1,at point A,
A) There is inefficient use of available resources.
B) The available technology keeps production inside PP1.
C) All available resources are being used efficiently.
D) An increase in the production of mops would definitely require a decrease in the production of brooms.
F) C) and D)
Correct Answer

verified
Correct Answer
verified
Multiple Choice
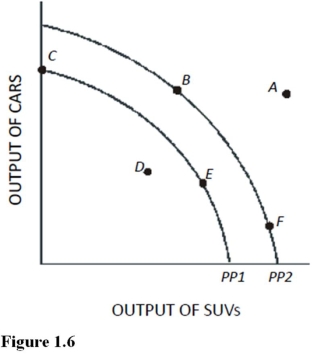
 In Figure 1.6,if the opportunity cost of producing cars was zero at all levels of production,the production possibilities curve would be best be represented by a
A) Vertical line.
B) 45-degree line starting at the origin.
C) Horizontal line.
D) Circle.
F) All of the above
Correct Answer

verified
Correct Answer
verified
True/False
The production possibilities decrease as more resources and better technology are utilized. More resources and better technology create a greater capacity to produce.
B) False
Correct Answer

verified
Correct Answer
verified
True/False
To calculate the slope of a line,find the vertical distance between two points and divide it by the horizontal distance between the same two points. This is the same as rise over run,or change in y divided by change in x.
B) False
Correct Answer

verified
Correct Answer
verified
Multiple Choice
Table 1.1 shows the hypothetical trade-off between different combinations of Stealth bombers and B-1 bombers that might be produced in a year with the limited U.S.capacity,ceteris paribus.Complete the table by calculating the required opportunity costs for both the B-1 and Stealth bombers. The highest opportunity cost anywhere in Table 1.1 for B-1 bombers in terms of Stealth bombers is
A) 1 Stealth bomber per B-1 bomber.
B) 3 Stealth bombers per B-1 bomber.
C) 2 Stealth bombers per B-1 bomber.
D) 0.5 Stealth bomber per B-1 bomber.
F) A) and C)
Correct Answer

verified
Correct Answer
verified
Multiple Choice
Which of the following correctly characterizes the shape of a constant opportunity cost production possibilities curve?
A) A straight line indicating that the law of increasing opportunity costs applies.
B) A straight line when there is constant opportunity costs.
C) A line that curves outward when resources are perfectly adaptable in the production of different goods.
D) A line that curves inward when resources are perfectly adaptable in the production of different goods.
F) A) and B)
Correct Answer

verified
Correct Answer
verified
Multiple Choice
Table 1.1 shows the hypothetical trade-off between different combinations of Stealth bombers and B-1 bombers that might be produced in a year with the limited U.S.capacity,ceteris paribus.Complete the table by calculating the required opportunity costs for both the B-1 and Stealth bombers. Table 1.1 Production Possibilities for Bombers On the basis of your calculations in Table 1.1,what is the opportunity cost of producing at point S rather than point T?
A) 1 Stealth bomber.
B) 1 B-1 bomber.
C) 10 Stealth bombers.
D) 0.9 Stealth bombers.
F) A) and C)
Correct Answer

verified
Correct Answer
verified
True/False
Output combinations that lie inside the production possibilities curve are characterized by efficient use of resources. Efficient levels of production lie on the production possibilities curve.
B) False
Correct Answer

verified
Correct Answer
verified
Multiple Choice
The slope of a curve at any point is given by this formula:
A) The change in y coordinates between two points divided by the change in their x coordinates.
B) The change in x coordinates between two points divided by the change in their y coordinates.
C) The percentage change in y coordinates between two points divided by the percentage change in their x coordinates.
D) The percentage change in x coordinates between two points divided by the percentage change in their y coordinates.
F) A) and B)
Correct Answer

verified
Correct Answer
verified
Multiple Choice
In using a guns and butter production possibilities curve with increasing opportunity cost,producing more and more tanks
A) Lowers the cost of each individual tank.
B) Can be done at a constant opportunity cost.
C) Requires us to give up larger and larger amounts of butter per tank produced.
D) Is not possible due to scarcity.
F) A) and C)
Correct Answer

verified
Correct Answer
verified
Multiple Choice
Economics can be defined as the study of
A) For whom resources are allocated to increase efficiency.
B) How society spends the income of individuals.
C) How scarce resources are allocated on a macro level to best meet society's goals or on a micro level to best meet an individual's or firm's goals.
D) None of the choices are correct.
F) A) and B)
Correct Answer

verified
Correct Answer
verified
Showing 21 - 40 of 141
Related Exams