B) False
Correct Answer

verified
Correct Answer
verified
Multiple Choice
A sample of experienced typists revealed that their mean typing speed is 87 words per minute and the median typing speed is 73 words per minute. The standard deviation of typing speed is 16.9 words per minute. What is the Pearson coefficient of skewness?
A) −2.5
B) −4.2
C) +4.2
D) +2.5
F) B) and C)
Correct Answer

verified
Correct Answer
verified
Multiple Choice
The median of a sample will always equal the ________.
A) mode
B) mean
C) 50th percentile
D) All of these answers are correct.
F) A) and D)
Correct Answer

verified
Correct Answer
verified
Multiple Choice
What is the possible range of values for Pearson's coefficient of skewness?
A) −1 and +1
B) −3 and +3
C) 0% and 100%
D) Unlimited values
F) B) and C)
Correct Answer

verified
Correct Answer
verified
Multiple Choice
A dot plot can be used to show ________.
A) the mean,median,and mode
B) the general shape of a distribution for a nominal qualitative variable
C) the distribution for a quantitative variable
D) the interquartile range
F) B) and C)
Correct Answer

verified
Correct Answer
verified
True/False
A dot plot is useful for showing individual observations.
B) False
Correct Answer

verified
Correct Answer
verified
Multiple Choice
What statistics are needed to draw a box plot?
A) The minimum,maximum,median,first and third quartiles
B) The median,mean,and standard deviation
C) The median and interquartile range
D) The mean and standard deviation
F) A) and D)
Correct Answer

verified
Correct Answer
verified
True/False
A box plot shows the skewness of a distribution.
B) False
Correct Answer

verified
Correct Answer
verified
Multiple Choice
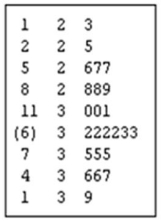
The following table is a ________. 
A) dot plot
B) stem-and-leaf display
C) box plot
D) contingency table
F) All of the above
Correct Answer

verified
Correct Answer
verified
Multiple Choice
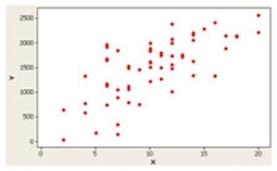
The following graph illustrates ________. 
A) a positive or direct relationship
B) a negative or inverse relationship
C) no relationship
D) a distribution for a single variable
F) C) and D)
Correct Answer

verified
Correct Answer
verified
Multiple Choice
What is the value of the Pearson coefficient of skewness for a distribution with a mean of 17,a median of 12,and a standard deviation of 6?
A) +2.5
B) −2.5
C) +0.83
D) −0.83
F) A) and D)
Correct Answer

verified
Correct Answer
verified
True/False
Pearson's coefficient of skewness is a measure of a distribution's symmetry.
B) False
Correct Answer

verified
Correct Answer
verified
Multiple Choice
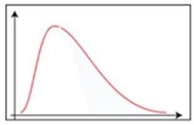
The following graph is ________. 
A) positively skewed
B) negatively skewed
C) symmetric
D) uniformly distributed
F) A) and C)
Correct Answer

verified
Correct Answer
verified
Multiple Choice
Which of the following is NOT a measure of dispersion?
A) The interquartile range
B) The standard deviation
C) The 50th percentile
D) The range
F) None of the above
Correct Answer

verified
Correct Answer
verified
Multiple Choice
In the following table, 
A) there are 16 observations.
B) there are 4 observations in the second class.
C) there are 10 observations less than 30.
D) there are 10 observations greater than 30.
F) A) and B)
Correct Answer

verified
Correct Answer
verified
True/False
If a distribution is negatively skewed,the distribution is not symmetrical and the long tail is to the left.
B) False
Correct Answer

verified
Correct Answer
verified
True/False
The 50th percentile of a distribution is the same as the distribution mean.
B) False
Correct Answer

verified
Correct Answer
verified
Multiple Choice
The following graph is a ________. 
A) Dot plot
B) Stem-and-leaf diagram
C) Box plot
D) Contingency table
F) C) and D)
Correct Answer

verified
Correct Answer
verified
Multiple Choice
A dot plot is best applied for a data set with ________.
A) 1,000 observations
B) 50 observations
C) more than one variable
D) one mode
F) None of the above
Correct Answer

verified
Correct Answer
verified
True/False
A student scored in the 85th percentile on a standardized test. This means that the student scored lower than 85% of all students who took the test.
B) False
Correct Answer

verified
Correct Answer
verified
Showing 21 - 40 of 64
Related Exams