A) a non-binding price ceiling.
B) a non-binding price floor.
C) a missing market.
D) the market for an inferior good.
F) A) and C)
Correct Answer

verified
Correct Answer
verified
Multiple Choice
A tax on sellers has what effect on a market?
A) Supply shifts vertically upward by the amount of the tax.
B) Demand shifts vertically downward by the amount of the tax.
C) Equilibrium price decreases and equilibrium quantity decreases.
D) Equilibrium price decreases and equilibrium quantity increases.
F) All of the above
Correct Answer

verified
Correct Answer
verified
Multiple Choice
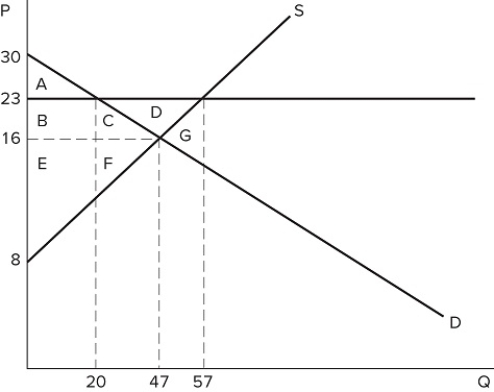 If a price floor is set at $23 in the market shown in the graph, which area(s) would represent consumer surplus?
A) A
B) A + B
C) A + B + C
D) A + B + C + D
F) B) and D)
Correct Answer

verified
Correct Answer
verified
Multiple Choice
Which of the following is a prominent argument against the use of price ceilings?
A) They are unfair.
B) They lead to an increase in surplus but a waste of society's resources.
C) They lead to a decrease in total surplus.
D) They raise corporate profits.
F) A) and D)
Correct Answer

verified
Correct Answer
verified
Multiple Choice
Which of the following exemplifies a market failure?
A) One person's consumption of a good imposes costs on others.
B) A firm selling a product faces competition from many other sellers.
C) A good is priced too high for poor families to afford.
D) The distribution of surplus in a market is unfair.
F) B) and C)
Correct Answer

verified
Correct Answer
verified
Multiple Choice
Does a tax on sellers affect the supply curve?
A) Yes; the supply curve shifts to the left by the amount of the tax.
B) Yes; the supply curve shifts to the right by the amount of the tax.
C) Yes; the supply curve shifts up by the amount of the tax.
D) No; the supply curve does not move, as there is a change in the quantity supplied instead.
F) A) and D)
Correct Answer

verified
Correct Answer
verified
Multiple Choice
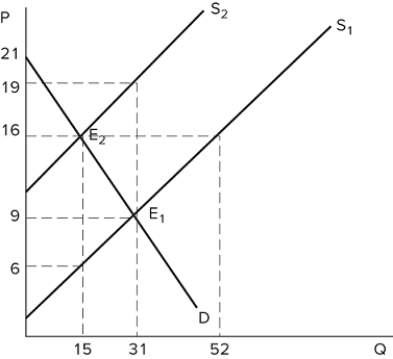 The graph shown demonstrates a tax on sellers. What amount of deadweight loss is generated by this tax?
A) $0
B) $80
C) $160
D) $129
F) B) and C)
Correct Answer

verified
Correct Answer
verified
Multiple Choice
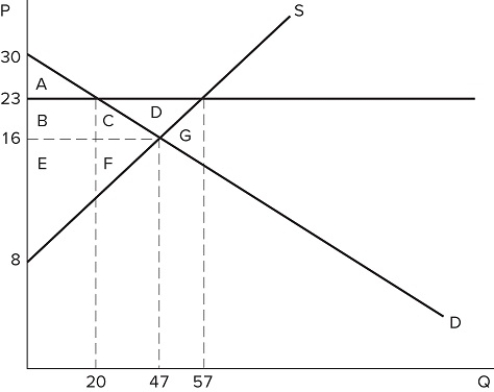 If a price floor is set at $23 in the market shown in the graph, the total number of units traded will:
A) fall by 20, relative to equilibrium.
B) fall by 27, relative to equilibrium.
C) fall by 37, relative to equilibrium.
D) rise by 10, relative to equilibrium.
F) A) and D)
Correct Answer

verified
B
Correct Answer
verified
Multiple Choice
 If the intended aim of the price ceiling set at $6, as shown in the graph, was a net increase in the well-being of consumers, then positive analysis would conclude that the policy was:
A) effective because the surplus gained by consumers through lower prices is greater than the surplus they lost due to fewer transactions taking place.
B) ineffective because the surplus gained by consumers through lower prices is less than the surplus they lost due to fewer transactions taking place.
C) effective because the surplus lost by producers through lower prices is less than the surplus gained by consumers through lower prices.
D) ineffective because the amount of deadweight loss is greater than the surplus gained by consumers from lower prices.
F) A) and C)
Correct Answer

verified
A
Correct Answer
verified
Multiple Choice
Which of the following is a prominent argument against the use of price floors?
A) Non-price rationing must occur and can lead to consumers waiting for goods or services.
B) The cost to taxpayers will increase if the government buys all surplus.
C) Producers will reduce the quality of the goods they sell.
D) Price floors transfer surplus from producers to consumers.
F) A) and D)
Correct Answer

verified
Correct Answer
verified
Multiple Choice
A subsidy:
A) has the exact same impact on the quantity exchanged as a tax.
B) has a larger impact on the quantity exchanged than a tax of the same amount.
C) has a smaller impact on the quantity exchanged than a tax of the same amount.
D) has the exact opposite impact on the quantity exchanged than a tax of the same amount.
F) A) and C)
Correct Answer

verified
Correct Answer
verified
Multiple Choice
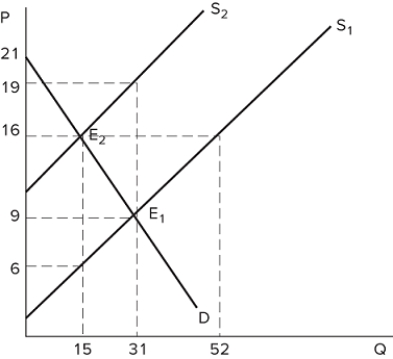 Suppose a tax on sellers has been imposed in the market shown in the graph. What is the total tax paid per unit of the good?
A) $16
B) $6
C) $10
D) $15
F) B) and C)
Correct Answer

verified
Correct Answer
verified
Multiple Choice
Why might a government impose a minimum wage?
A) To correct a market failure
B) To redistribute surplus in a market
C) To encourage the consumption of inferior goods
D) To discourage the consumption of inferior goods
F) A) and C)
Correct Answer

verified
Correct Answer
verified
Multiple Choice
How might a government attempt to protect dairy farmers from low milk prices?
A) Banning households from hoarding milk
B) Setting a minimum price on milk
C) Increasing taxes on dairy farmers
D) Reducing subsidies on the price of milk
F) A) and C)
Correct Answer

verified
Correct Answer
verified
Multiple Choice
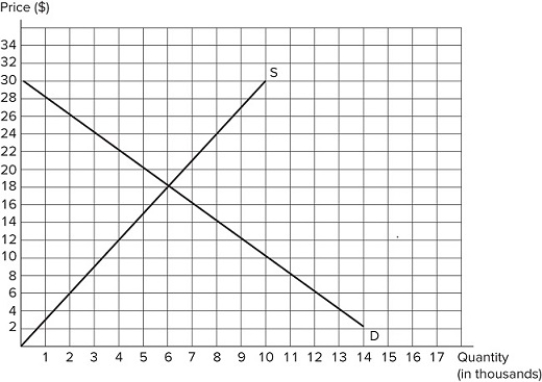 Suppose a $10 tax is imposed on sellers in the market shown in the graph. What will be the deadweight loss?
A) $15,000
B) $20,000
C) $12,500
D) $10,000
F) B) and C)
Correct Answer

verified
Correct Answer
verified
Multiple Choice
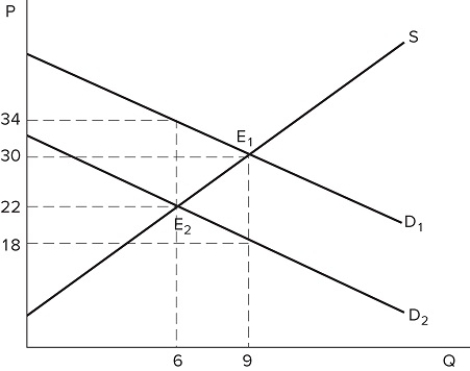 The graph shown demonstrates a tax on buyers. How much are buyers being taxed on each unit sold?
A) $4
B) $8
C) $12
D) $16
F) A) and B)
Correct Answer

verified
Correct Answer
verified
Multiple Choice
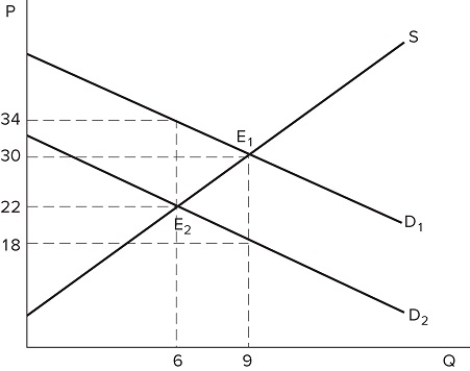 The graph shown demonstrates a tax on buyers. After the tax has been imposed, sellers produce _______ units, and the post-tax price received for each one sold is _______.
A) 6; $22
B) 6; $34
C) 9; $18
D) 9; $30
F) B) and C)
Correct Answer

verified
Correct Answer
verified
Multiple Choice
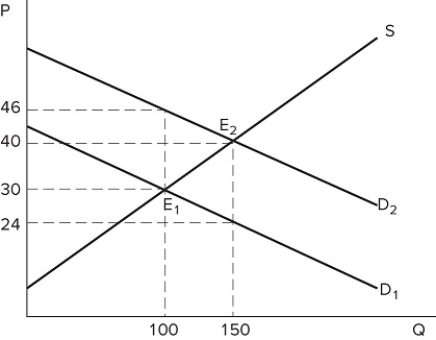 The graph shown best represents:
A) a tax on sellers.
B) a subsidy to sellers.
C) a price floor.
D) a subsidy to buyers.
F) B) and C)
Correct Answer

verified
Correct Answer
verified
Multiple Choice
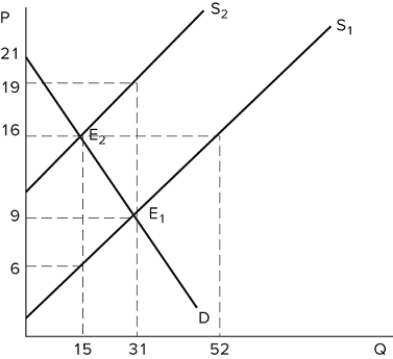 Suppose a tax has been imposed in the market shown in the graph. Which kind of tax is most likely demonstrated by this graph?
A) A tax on sellers
B) A tax on buyers
C) A tax on big corporations
D) A price ceiling
F) A) and D)
Correct Answer

verified
Correct Answer
verified
Multiple Choice
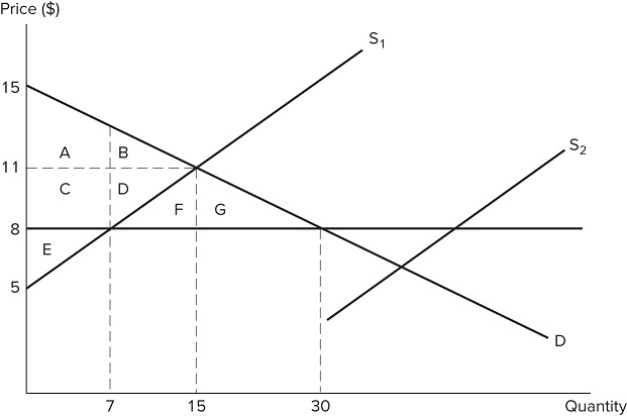 Suppose S1 represents the initial market supply in the graph shown. A price ceiling is then set at $8. If supply shifts from S1 to S2, what will occur?
A) The price ceiling will no longer be binding.
B) The price ceiling will prevent output from changing.
C) The size of the shortage will increase.
D) The market will not reach equilibrium.
F) None of the above
Correct Answer

verified
A
Correct Answer
verified
Showing 1 - 20 of 171
Related Exams