A) Impose an equilibrium price of $1.20.
B) Impose a price ceiling of $2.00.
C) Impose a price floor of $1.80.
D) Impose an equilibrium price of $1.80.
E) Impose a price ceiling of $1.80.
G) B) and D)
Correct Answer

verified
Correct Answer
verified
Multiple Choice
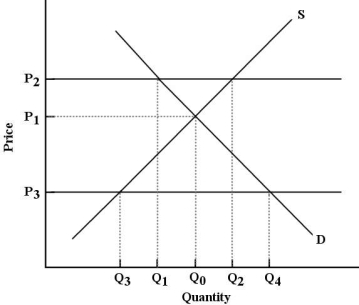
 FIGURE 5- 3
-Refer to Figure 5- 3. If the government imposes a price floor at P3, the result would be a price and quantity combination of
A) P1 and Q0.
B) P3 and Q0.
C) P3 and Q3.
D) P2and Q1.
E) P3 and Q4.
G) A) and D)
Correct Answer

verified
Correct Answer
verified
Multiple Choice
Consider a market that is in equilibrium with a market- clearing price. Economic surplus is shown by
A) the area that is both below the demand curve and above the supply curve.
B) the area to the right of the market- clearing price and quantity.
C) the intersection of the supply and demand curves.
D) the area below the supply curve up to the equilibrium quantity and below the demand curve beyond the equilibrium quantity.
E) the area that is both above the demand curve and below the supply curve.
G) B) and D)
Correct Answer

verified
Correct Answer
verified
Multiple Choice
Each point on a supply curve shows the _ _ acceptable price to firms for selling that unit; this price reflects to firms from producing that unit.
A) maximum; the additional value
B) maximum; the additional cost
C) minimum; the equilibrium price
D) minimum; the additional value
E) minimum; the additional cost
G) A) and D)
Correct Answer

verified
Correct Answer
verified
Multiple Choice
-Refer to Table 5- 1. Suppose the government imposed a price of $0.60 per chocolate bar. The result would be
A) excess supply of 1750 chocolate bars per week.
B) stockpiling of unsold chocolate bars.
C) excess supply of 450 chocolate bars per week.
D) excess demand of 2200 chocolate bars per week.
E) excess demand of 450 chocolate bars per week.
G) A) and C)
Correct Answer

verified
Correct Answer
verified
Multiple Choice
The long- run elasticity of supply of rental housing is greater than the short- run elasticity of supply because
A) changes in supply occur only after investment decisions are made regarding, for example, new construction or conversion of rental housing to other uses.
B) changes in supply can occur very quickly, especially when rent controls are in place.
C) in the long run, landlords have no incentive to alter the supply of rental housing.
D) the demand for rental housing is changing continuously.
E) investment in new rental housing has such a short payback period.
G) A) and B)
Correct Answer

verified
Correct Answer
verified
Multiple Choice
In free and competitive markets, surpluses are eliminated by
A) price decreases.
B) price increases.
C) government purchases.
D) government price controls.
E) black markets.
G) A) and D)
Correct Answer

verified
Correct Answer
verified
Multiple Choice
One measure of market inefficiency is
A) the size of the deadweight loss.
B) the size of the economic surplus.
C) how far quantity exchanged deviates from equilibrium.
D) how far market price deviates from equilibrium.
E) the difference between total economic surplus and deadweight loss.
G) A) and E)
Correct Answer

verified
Correct Answer
verified
Multiple Choice
In competitive markets, price floors and price ceilings usually lead to
A) more equitable distributions of commodities.
B) surpluses.
C) production control by the government.
D) shortages.
E) a reduction in quantities exchanged.
G) A) and B)
Correct Answer

verified
Correct Answer
verified
Multiple Choice
An excess demand for some product is the same thing as
A) back market.
B) an excess supply.
C) a shortage.
D) a surplus.
E) price ceiling.
G) None of the above
Correct Answer

verified
Correct Answer
verified
Multiple Choice
Consider the following demand and supply schedules for some agricultural commodity. -Refer to Table 5- 2. Suppose we begin in a free- market equilibrium. If the government then imposes a production quota of 500 units, total farmers' income
A) remains unchanged.
B) decreases by $500.
C) increases by $800.
D) decreases by $700.
E) increases by $500.
G) A) and B)
Correct Answer

verified
Correct Answer
verified
Multiple Choice
In the short run, the supply of rental accommodations tends to be
A) very price elastic.
B) unit price elastic.
C) very or completely price inelastic.
D) irrelevant to the housing market price.
E) infinitely price elastic.
G) D) and E)
Correct Answer

verified
Correct Answer
verified
Multiple Choice
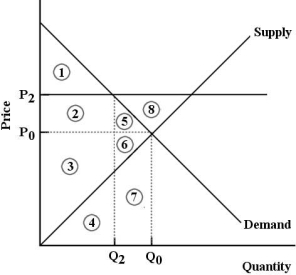
 FIGURE 5- 7
-Refer to Figure 5- 7. The market for good X is in equilibrium at P0 and Q0. Now suppose the government imposes a at P2. One result would be .
A) price floor; a deadweight loss represented by area 8.
B) price ceiling; a deadweight loss represented by areas 5 and 6.
C) price floor; an increase in economic surplus represented by area 1.
D) price ceiling; an increase in economic surplus represented by areas 2 and 5.
E) price floor; a deadweight loss represented by areas 5 and 6.
G) B) and E)
Correct Answer

verified
Correct Answer
verified
Multiple Choice
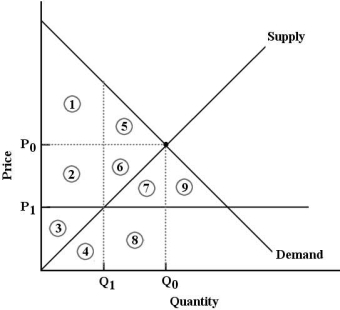
 FIGURE 5- 6
-Refer to Figure 5- 6. The market for good X is in equilibrium at P0 and Q0. Economic surplus is represented by
A) areas 2, 3, 4, 6, 7, 8.
B) areas 1, 2, 3, 5, 6.
C) areas 2, 3, 4, 6, 7, 8, 9.
D) areas 1 and 5.
E) areas 1, 2, 3, 4, 5, 6, 7, 8.
G) C) and D)
Correct Answer

verified
Correct Answer
verified
Multiple Choice
Each point on a demand curve shows the quantity. The demand curve therefore shows the product. 

A) maximum; cost
B) minimum; value
C) minimum; cost
D) equilibrium; equilibrium price
E) maximum; value
G) None of the above
Correct Answer

verified
Correct Answer
verified
Multiple Choice
The short- run supply for housing is quite while the long- run supply for housing is quite .
A) inelastic; elastic
B) elastic; inelastic
C) flat; steep
D) inelastic; inelastic
E) elastic; elastic
G) A) and D)
Correct Answer

verified
Correct Answer
verified
Multiple Choice
An excess supply of some product is the same thing as
A) scarcity.
B) a shortage.
C) price floor.
D) a surplus.
E) an excess demand.
G) C) and D)
Correct Answer

verified
Correct Answer
verified
Multiple Choice
 FIGURE 5- 1
-Refer to Figure 5- 1. To be binding, a legal price ceiling must lie
A) anywhere above 0.
B) below P0 but above P3.
C) anywhere above P0.
D) above P0 but below P2.
E) anywhere below P0.
G) B) and E)
Correct Answer

verified
Correct Answer
verified
Multiple Choice
With respect to some commodity, X, if government objectives are to (1) restrict production and (2) keep prices down to protect consumers, then legislated price ceilings will
A) be a dismal failure as neither goal can ever be achieved with price ceilings.
B) satisfy both goals as long as a black market does not develop.
C) only have an effect on commodities at the international level.
D) satisfy only the second goal if a black market develops.
E) satisfy both goals but only if a black market develops.
G) A) and D)
Correct Answer

verified
Correct Answer
verified
Multiple Choice
If the government imposes a price ceiling for some product, and a black market subsequently develops that gains control of all of the reduced output of the product, then
A) the quantity demanded will exceed quantity supplied at the black market price.
B) the black market price will be lower than the ceiling price.
C) consumers will be better off than they would be in the absence of the black market.
D) excess profits will flow back to consumers.
E) the black market price will be higher than the free- market equilibrium price.
G) B) and C)
Correct Answer

verified
Correct Answer
verified
Showing 81 - 100 of 114
Related Exams